
BigQuery and Looker Studio: connection and first report
On this page
The BigQuery integration automatically exports your company's data from Bimp to Google cloud storage, and Looker Studio builds dashboards from it. To start, the company owner sends support the company ID and a Google email, after which a report with the BigQuery connector and a table from the bimp_public dataset is created in Looker Studio.
What the BigQuery and Looker Studio integration gives you
The BigQuery integration automatically exports all of the company’s operational data from Bimp to Google cloud storage, and Looker Studio, a free Google tool, turns the tables into interactive charts and dashboards that update on their own. This is useful when the standard Bimp reports are no longer enough. All articles in this section are listed on the “BI analytics” page. If you need to export the data with your own script, see exporting Bimp data for analytics via the API.
Typical tasks:
- Margin control. Net profit by manager or product category, taking additional costs such as logistics into account.
- Balance analysis. Month-by-month dynamics of warehouse balances and highlighting of items that are running out.
The data structure is described in BigQuery table field reference.
How to activate data export
Bimp technical support turns on the export at the request of the company owner. You cannot turn it on yourself in the interface.
- Sign in to Bimp as the company owner, click the logo or avatar in the top right corner and choose Company settings.
- In the company data block, copy the “Company ID”.
- Prepare a Google account (@gmail.com or a corporate email on Google Workspace) that you will use in Looker Studio.
- Create a request to technical support. Include: a request to connect the BigQuery integration, the copied company ID and the Google email to be given access.
- Wait for confirmation by email: the initial export of historical data takes some time.
How to create a report and connect a BigQuery table
To connect Bimp data to Looker Studio, create a report, choose the BigQuery connector and specify a table from the “bimp_public” dataset of the “Bimpsoft” project.
- Open the Looker Studio home page. In the top left corner click Create and choose Report.
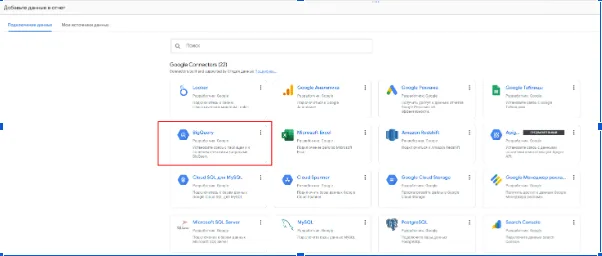
- In the add data window, in the “Google Connectors” section, click the BigQuery card.
- Move through the columns from left to right: “My projects” → the “Bimpsoft” project → the “bimp_public” dataset → the table you need, for example “v_fact_orders” (orders) or “v_dim_employees” (employees).
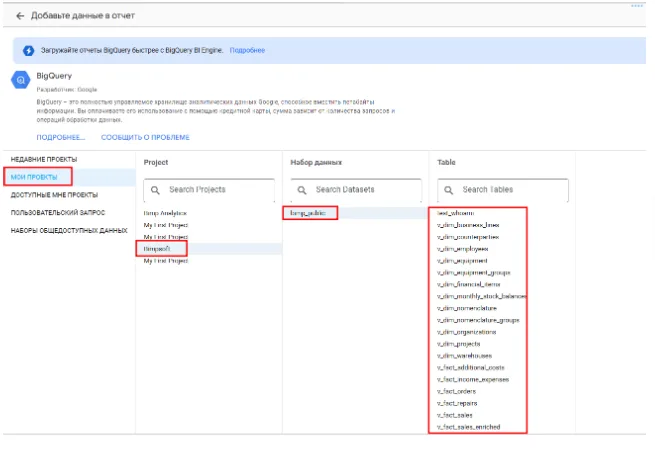
- Click the blue Add button in the bottom right corner.
The report workspace then opens, where you can add charts, tables and filters based on the chosen table. Add each following table the same way.
What to do if “No access to dataset” appears
The error means that Looker Studio reads data on behalf of the viewer, who has no BigQuery permissions. The fix is to switch the source credentials to “Credentials of a user with read access”. For step-by-step instructions, see No access to dataset in Looker Studio.
How to choose fields for a report
In a report, combine metrics and dimensions from BigQuery tables:
| Type | What it is | Examples |
|---|---|---|
| Metrics | Numeric values | “cost_amount” is the cost price amount, “quantity” is the quantity |
| Dimensions | Analytical breakdowns | “movement_date” is the operation date, “product_name” is the product name |
Fields with the suffix _guid link tables together: for example, “item_guid” connects a sales row to the product name in “v_dim_nomenclature”. In Looker Studio, you build such a link by blending data sources.
FAQ
What is the Bimp integration with BigQuery?
It is an automatic export of the company's operational data (sales, warehouses, finance, employees) to Google BigQuery cloud storage. Looker Studio, Power BI or SQL queries read the data from there.
Who can submit a BigQuery connection request?
Only the company owner, because the company ID needed for the request is visible only to the owner in "Company settings".
How much does Looker Studio cost?
Looker Studio is a free visualization platform from Google. You only need a Google account (@gmail.com or Google Workspace).
Which date should I use in reports: exported_at or document_date?
For business reports use document_date or movement_date. The fields exported_at, created_at and updated_at are technical dates of export or record change.