
Reports in Bimp: filters, grouping, templates, export
On this page
All Bimp reports open from the "Reports" menu and share the same interface: period and filters on the left, "Group by" and "Detail by" fields at the top, the "Generate report" button and a table with a "Total" row. Filter settings can be saved as a template, and a finished report can be downloaded with the arrow button in the header. Only posted documents get into reports.
How to open a report and what is on the screen
A report opens from the main Reports menu: select the report you need from the list. All reports have the same screen structure, so skills from one report work in the others. All articles in this section are listed on the “Reports” page. If a report total does not change when you search, see common interface errors.
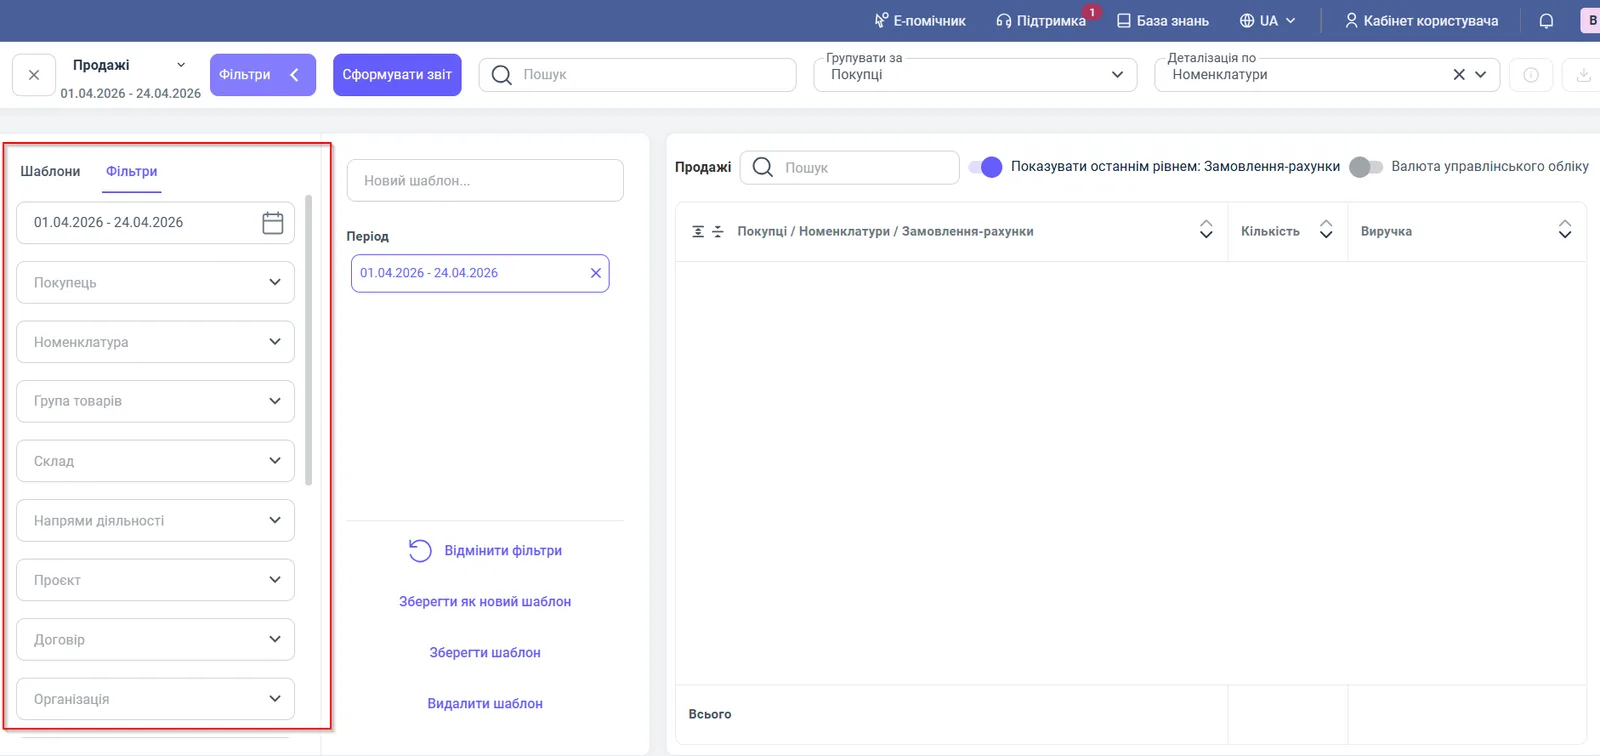
The top panel of a report contains:
| Element | Purpose |
|---|---|
| Report name with an arrow | Switching to another report without going back to the list |
| Period under the name | The current period of the report |
| Filters | Opens and hides the left panel with the period, filters and templates |
| Generate report | Builds the table with the current settings |
| “Search” | Finds a row in an already generated table |
| “Group by” | The first level of the table |
| “Detail by” | Nested levels inside a group |
| Down-arrow button | Downloads the report |
Below is the report table with the “Total” row at the bottom. The arrows next to column headers sort the table, and the icons to the left of the first column header expand and collapse all groups at once.
How to set a period and filters
The period and filters are set in the left panel, which opens with the Filters button. Filters remove unneeded data before the report is generated.
- Open the report in the Reports menu and click Filters.
- Click the calendar at the top of the panel and select a time range, for example the current month.
- Select values in the fields you need. The set of filters depends on the report: for sales it is “Customer”, “Product”, “Product group”, “Warehouse”, “Lines of business”, “Project”, “Contract”, “Organization”; for money reports it is “Bank account”, “Cash register”, “Currency”, “Cash flow item”.
- Click Generate report.
The Reset filters button at the bottom of the panel clears all values.
How to group and detail data
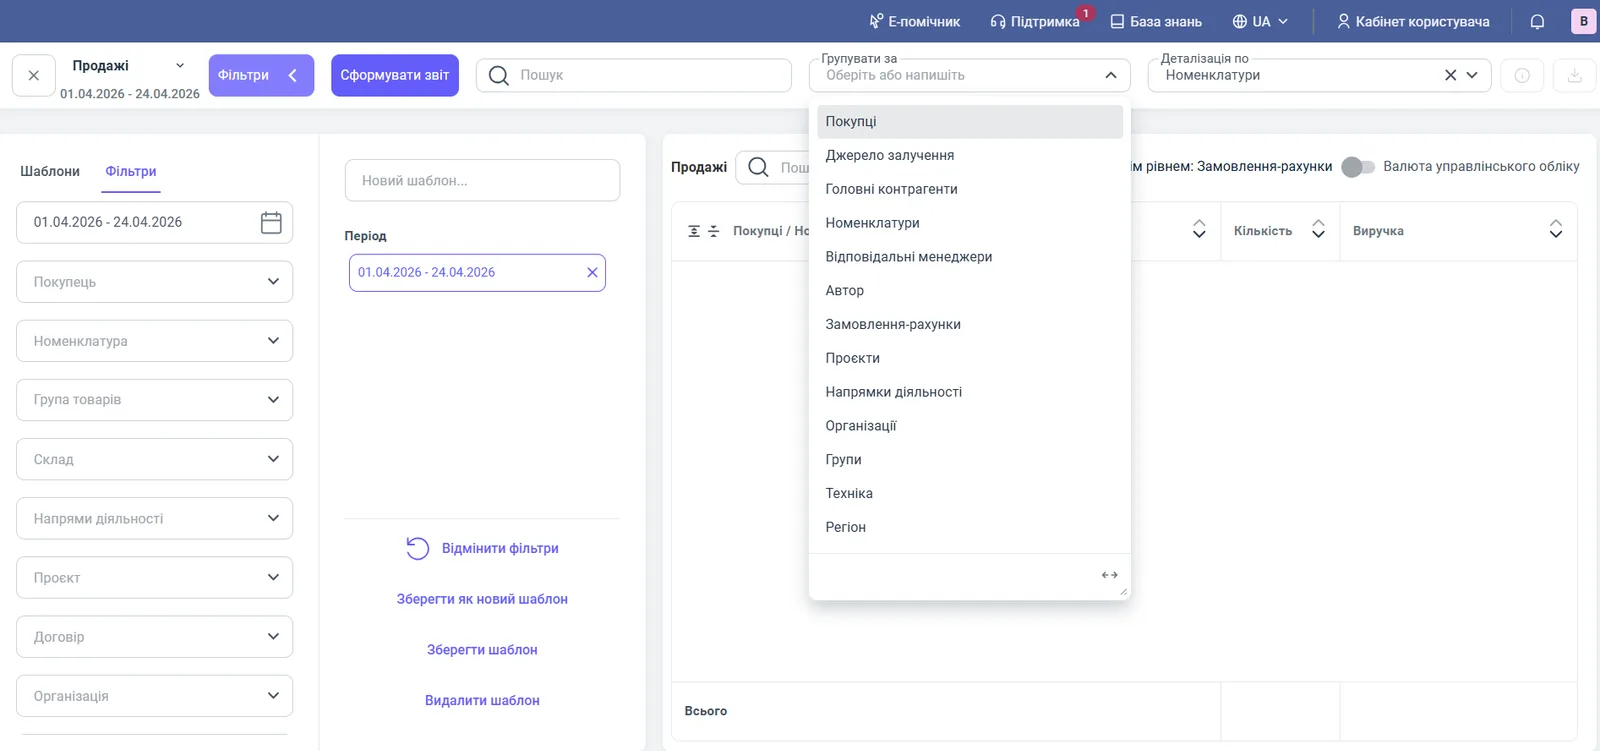
The “Group by” field builds the first level of the table, and “Detail by” adds nested levels. For example, when you group by customers and detail by products, each customer row expands into a list of the goods they bought.
The available options depend on the report. In sales reports you can group by customers, parent counterparties, acquisition source, products, managers, author, order invoices, projects, lines of business, organizations, groups, equipment and region. In money reports you group by bank accounts and cash registers, cash flow items, item groups, currencies or types of activity.
Reports also have switches above the table:
| Switch | What it does |
|---|---|
| “Show as last level: …” or “Show third level: Documents” | Adds a last level with the specific documents the amount was taken from |
| “Management accounting currency” | Converts all amounts to a single management accounting currency |
| “by days” / “by months” / “by quarters” | Splits amounts into columns by period (in reports with dynamics) |
| “Show closed debts” | In debt reports, adds closed documents to the unclosed ones |
If an amount in a report is unclear, turn on the “Documents” level and expand the row: this shows which document produced it.
How to save a report template
A template remembers the period and filter values, so the report opens in one click. Templates are stored in the left panel, on the “Templates” tab.
- Set the period and filters on the “Filters” tab.
- Enter a name in the “New template…” field.
- Click Save as new template.
To change an existing template, select it, fix the filters and click Save template. The Delete template button removes a template you no longer need.
How to download a report
A generated report is saved to your device with the down-arrow button in the top panel (in the Sales Dynamics report it is labeled “Download report”). First click Generate report, then the download button.
Which documents get into reports
Each report is built from specific documents, and this is the source of most “why do the numbers not match” questions. General rules:
- Sales (the Sales, Sales Dynamics and Gross Profit reports): Sales of goods and services and Customer return.
- Money reports: payment documents: receipts to an account and write-offs from an account, cash receipt and cash payment orders. Money movement is counted by the fact of payment, not by shipment.
- Expenses and financial result: accrual and expense documents: payroll accrual, expense report, depreciation, Goods receipt, Write-off, “Other expenses”.
The full list of documents is in the article for each specific report. For the difference between the cash method and the accrual method, see Income and Expenses (P&L) and Cash Flow.
Common questions
The report is empty. Check the period, the filters and whether documents are posted. One extra filter, such as “Warehouse”, cuts out everything else.
Amounts differ between reports. Reports select data differently: sales use the shipment date, money uses the payment date, expenses use the accrual document. Compare only reports with the same logic and the same period.
Amounts in different currencies. Turn on the “Management accounting currency” switch to see a single total.
FAQ
Why is the report empty although the documents have been created?
Reports are built only from posted documents. Check that the documents are posted and that the period and filters do not exclude them. If the report was generated before posting, click “Generate report” again.
How do I save report settings so I do not enter them every time?
Set the period and filters, enter a name in the “New template...” field and click “Save as new template”. Next time, open the “Templates” tab and select it.
What is the difference between “Group by” and “Detail by”?
“Group by” sets the first level of the table (for example, customers), and “Detail by” sets the nested rows inside each group (for example, the customer's products).
Can I export a report to a file?
Yes, the top panel of the report has a down-arrow button (“Download report”). It saves the current table to your device.