
Income and Expenses (P&L) report: the financial result of your company
On this page
The Income and Expenses (P&L) report shows the company's financial result on an accrual basis: sales revenue, cost price, gross profit, expenses by group and net profit. It opens from the "Reports" menu, is filtered by period, lines of business and project, and is grouped by years, quarters or months.
What the report is for
The Income and Expenses (P&L) report shows how much the company earned and spent over a period and what financial result is left. It complements the money reports: profit here is calculated on an accrual basis, not by the movement of funds. The report answers whether the business is profitable, what the profit consists of and which expense groups are the largest.
Typical tasks: assess profitability for a quarter, compare months, find the expense group that eats the margin, plan future results.
How to run it
- Open Reports → Income and Expenses (P&L).
- Click Filters and select a period. If needed, set “Lines of business” and “Project”.
- In the “Group by” field, select “by years”, “by quarters” or “by months”.
- Click Generate report.
You can save filters as a template together with the period, see Reports in Bimp: filters, grouping, templates, export.
Indicators
In the “Income and expense items” report, each row is an indicator or an item, and each column is a period.
| Row | What it means |
|---|---|
| “Sales revenue” | Revenue from sales |
| “Cost price” | The cost price of the goods sold |
| “Gross profit” | Sales revenue minus cost price |
| “Markup” | Gross profit divided by cost price, as a percentage |
| “Total operating expenses” | The sum of the expense groups below |
| “Production overheads” | For example, rent for production, pay of production staff |
| “Administrative expenses” | For example, pay of administrative staff |
| “Selling expenses” | For example, marketing, pay of sales staff |
| “Earnings before interest, taxes and depreciation” | Gross profit minus operating expenses |
| “Depreciation” | Depreciation charges |
| “Earnings before interest and taxes” | The previous row minus depreciation |
| “Interest expenses” | Financial expenses on interest |
Below that, the report shows non-operating income and expenses, net profit and its profitability. Non-operating expenses are grouped by the item hierarchy (other expenses, other operating expenses, other financial expenses); for details, see Non-operating income and expenses. Non-operating income currently has no hierarchical groups.
Items and groups are set up in the reference list, see Income and expense items.
Filters and grouping
| Parameter | Value |
|---|---|
| Filters | Period, “Lines of business”, “Project” |
| “Group by” | by years, by quarters, by months |
How to read the numbers: an example
A report for 01.02.2026 – 31.05.2026 grouped “by months”:
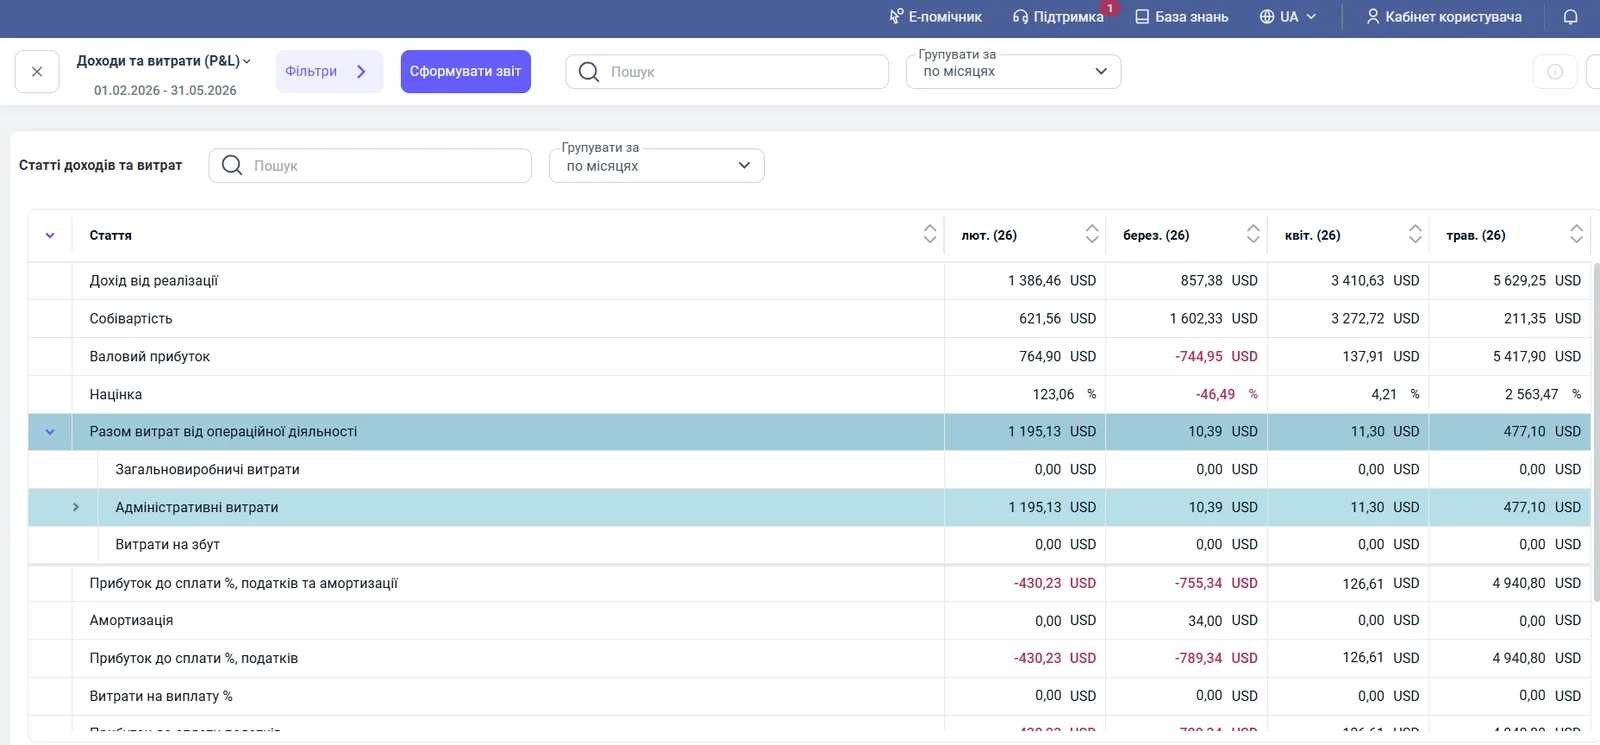
- February: revenue 1,386.46 − cost price 621.56 = gross profit 764.90 USD, markup 123.06%. Operating expenses of 1,195.13 USD give earnings before interest, taxes and depreciation of 764.90 − 1,195.13 = −430.23 USD.
- March: revenue 857.38 − cost price 1,602.33 = −744.95 USD (markup −46.49%): goods were sold below cost price. Expenses of 10.39 USD give −755.34 USD, and after depreciation of 34.00 USD the result is −789.34 USD.
Negative values are highlighted in red.
Why the numbers do not match
P&L shows a profit, but there is no money on the account. P&L is calculated on an accrual basis, while money is counted by actual movement. Compare with the Cash Flow report.
Expenses in P&L differ in structure from the Expenses report. P&L shows the full hierarchy of an item, while “Expenses” shows only the first-level group. If a document specifies a group rather than an item, the amount goes into the total of that group. See the Expenses report.
Gross profit differs from the Gross Profit report. Check that the period and filters (“Lines of business”, “Project”) are the same. For details, see the Gross Profit report.
FAQ
How is the P&L report different from the Cash Flow report?
P&L shows the result on an accrual basis: income and expenses are recorded by documents, even without actual payment. Cash Flow counts only real receipts and payments on accounts and in cash registers.
Why are expense items grouped differently in P&L than in the Expenses report?
P&L builds the full hierarchy branch for each item, while the Expenses report pulls up only the first-level group. See the section on differences in the Expenses report article.
Which periods can P&L be grouped by?
By years, quarters and months. Each period is shown as a separate column.