
Cost of Produced Goods report: what a finished product costs in materials
On this page
The Cost of Produced Goods report shows, for each product, which specification it was made by, how many materials were used, their total value and the cost price of one unit. To run it, open "Reports → Cost of Produced Goods", select a period and click "Generate report".
What the Cost of Produced Goods report is for
The Cost of Produced Goods report shows the real cost of a product made by a specification. Owners and production engineers use it to set prices correctly: if the cost price is unknown, the price may not cover the costs.
- Cost overruns. The cost price of a batch of cakes rose by 15%. The report shows that cream became more expensive and more sugar was used than the specification norm.
- Comparing specifications. Cabinets are made by two technologies. The report shows which one is cheaper thanks to less waste.
General report features are described in Reports in Bimp.
Which documents feed the report
Data gets into the report automatically after production documents are posted.
| Document | What it gives the report |
|---|---|
| Specification | the composition of the product: materials and services. See Specifications |
| Assembly | the fact of production; writes materials off the warehouse at their cost price. See Assembly |
| Disassembly | taking a product apart and returning materials to the warehouse. See Disassembly |
| Additional costs, Cost allocation, Piecework pay, Transfer to cost price | costs that are added to the cost price of the produced goods |
How to run the report
To see the cost of products, open the report, select a period and click the generate button.
- Open Reports → Cost of Produced Goods.
- Select a period in the calendar.
- If needed, set the “Product”, “Warehouse” and “Product group” filters.
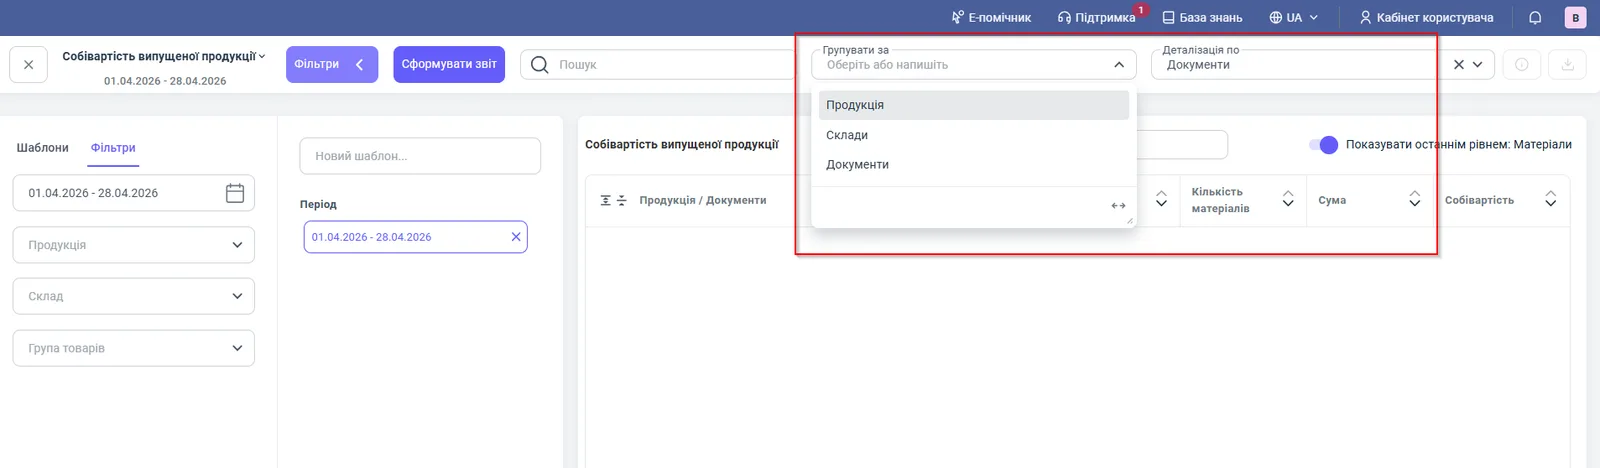
- Select “Group by” and “Detail by”.
- Click Generate report.
Indicators
| Column | What it means |
|---|---|
| “Finished product” | the name of the manufactured product |
| “Specification” | the specification the production was done by |
| “Product quantity” | the total number of units produced |
| “Materials quantity” | the total quantity of materials used for this quantity of products |
| “Amount” | the total value of the materials used |
| “Cost price” | the cost of one unit of the produced goods |
Filters and grouping
| Parameter | Value |
|---|---|
| “Product” filter | results for individual products |
| “Warehouse” filter | cost price by warehouse |
| “Product group” filter | cost price by product group |
| “Group by” | product (default), warehouses, documents |
| “Detail by” | documents or materials |
| “Show as last level: Materials” switch | expands a product to the list of materials and their values |
Detailing by documents shows exactly which production documents recorded the manufacturing.
How to read the numbers: an example
This is a hypothetical example. By the “Office cabinet” specification, 10 pcs were produced. 85 units of materials worth 5,000 UAH were used. So “Product quantity” is 10, “Materials quantity” is 85, “Amount” is 5,000 UAH, and the “Cost price” of one unit is 500 UAH. If next month the same product made by another specification comes to 460 UAH each, the second technology is 40 UAH per piece cheaper.
Why the numbers do not match
The cost price is abnormally low. Check whether all materials and costs have been written off to the cost of the products: whether assembly documents are posted, and whether additional costs and piecework pay documents exist.
The cost price changed after production. Late additional costs or corrections to a materials receipt change the cost of a product after recalculation. See Cost price recalculation.
The product is in the warehouse but not in the report. The report is built from posted assembly documents for the selected period. Check the period and the “Product”, “Warehouse” and “Product group” filters.
Indirect costs (rent, energy) are not visible. They appear in the product value after the “Cost allocation” document. For accumulation, see the Accumulated cost price report.
FAQ
Which documents does the cost of produced goods come from?
From posted assembly documents, which write off materials at their cost price, and from documents that add costs to the product value: additional costs, cost allocation, piecework pay and transfer to cost price.
How can I see which materials went into a product?
Turn on the “Show as last level: Materials” switch. Each product expands to a list of materials with their values.
Why is the cost price of a product too low?
Most likely not all materials and costs have been written off to the cost of the product. Check the assembly documents, additional costs and piecework pay.