
Sales Managers Pay report: profit by manager
On this page
The Sales Managers Pay report groups orders by responsible manager and shows the order amount, sales, cost price, gross and net profit and profitability. Bonus and KPI calculations are based on it. For a deal to go to a manager, the "Responsible manager" field in the order must be filled in.
What the report is for
The Sales Managers Pay report shows the result of each manager’s work over a period and gives a basis for calculating bonuses. It removes manual reconciliation in Excel: the report groups sales by manager itself, takes cost price and costs into account and shows the profitability of deals.
Example: a company pays managers 10% of net profit. According to the report, manager Petrov brought 33.47 USD of net profit, and manager Petrenko brought 98.42 USD. Bonuses are calculated in a minute.
Before you start
For a sale to go to a manager, fill in the “Responsible manager” field in the Customer order or Work order document (see Customer order). Otherwise the deal goes into the "
How to run the report
- Open Reports → Sales Managers Pay.
- Click Filters and specify the period in the calendar field.
- If needed, set filters.
- Click Generate report.
- Expand a manager’s row with the arrow to the left of the name to see their lines of business, customers, orders and product items.
General rules are in Reports in Bimp: filters, grouping, templates, export.
Indicators
| Column | What it means |
|---|---|
| “Order amount” | The total volume of the manager’s orders |
| “Sales amount” | The amount actually sold and shipped |
| “Cost price” | The cost of purchasing or producing the shipped goods |
| “Gross profit” | Sales amount minus cost price |
| “VAT/Costs amount” | VAT and additional costs recorded on the deal |
| “Net profit” | Gross profit minus VAT and costs |
| “Profitability” | Net profit divided by the sales amount, as a percentage |
Filters and grouping
Filters: “Manager”, “Lines of business”, “Customer”, “Product”, “Order invoice”, “Work order”. Table levels: manager, line of business, customer, order, product, batch. In the order sub-rows, sales and costs on the order are shown separately.
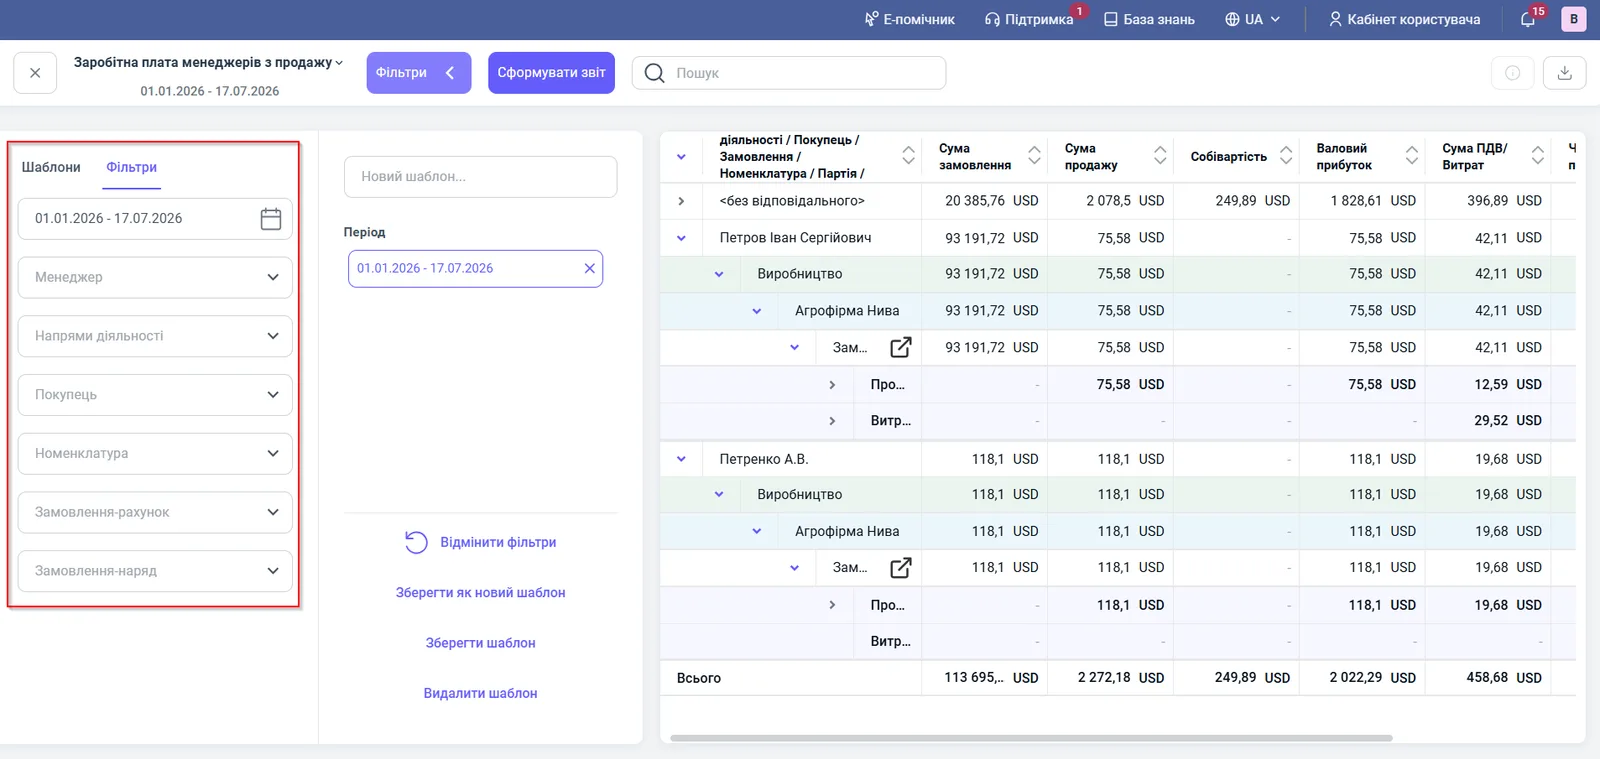
How to read the numbers: an example
In the report for 01.01.2026 – 17.07.2026, manager Petrov has a “Sales amount” of 75.58 USD, a “Gross profit” of 75.58 USD and a “VAT/Costs amount” of 42.11 USD. Net profit: 75.58 − 42.11 = 33.47 USD, profitability 33.47 / 75.58 = 44.28%. Manager Petrenko has sales of 118.1 USD and costs of 19.68 USD: net profit 98.42 USD, profitability 83.34%.
A manager with a smaller volume but higher profitability can bring the company more real profit than one who gives discounts for the sake of turnover. So analyze the profitability trend every month.
Why the numbers do not match
There is a "
The order amount is large, but sales are small. “Order amount” is the contracted volume, while “Sales amount” is what has already been shipped. For the difference, see the Shipments by Customer analysis report.
Cost price is empty, and gross profit equals sales. The cost price is not determined for the shipped goods. See the Gross Profit report.
There are no costs on the deal. Costs for an order must be accumulated separately, see Cost accumulation.
FAQ
What is the “<no responsible>” row in the report?
These are deals where the “Responsible manager” field is not filled in the Customer order or Work order. The manager gets no bonus for them. Open such orders, specify the manager, and the amounts will be redistributed.
How is a manager's net profit calculated?
Net profit equals gross profit minus the VAT amount and the costs on the deals. For example, gross profit of 75.58 USD minus 42.11 USD gives a net profit of 33.47 USD.
Does the report include services?
Yes, the report shows both sales of goods and completed work and services through Work order documents.