
Stock Movement report: opening and closing balance for a period
On this page
The Stock Movement report shows, for each warehouse and product, the opening balance, receipts, sales, write-offs, transfers and closing balance for the selected period, in units or in value. To run it, open "Reports → Stock Movement", enter a period and click "Generate report".
What the Stock Movement report is for
The Stock Movement report answers how much of a product was in the warehouse at the start of the period, what happened to it and how much is left at the end. It is used in three situations:
- Purchasing. The manager sees the closing balance and the speed of sales: if 15 units were sold in a week and 2 are left, it is time to order from the supplier.
- Warehouse and audit. If a quantity does not match the actual one, the report shows all inflow and outflow documents for the period, which helps find the stage where the error occurred.
- Write-off analysis. You can see how much of a product went into production, into defects or into transfers between warehouses.
General report features (templates, export, search) are described in Reports in Bimp.
Which documents feed the report
The report is built only from posted documents. An unposted document is not shown in the report.
| Document | How it affects the balance |
|---|---|
| Goods receipt, Return to supplier | increases or decreases the balance on purchasing, the “Receipts” column |
| Sales of goods and services, Customer return | decreases or increases the balance on sales, the “Sales” column |
| Stock transfer | moves goods between warehouses, the “Transfers” column |
| Write-off, Stock posting | adjusts the balance for defects and surpluses |
| Assembly, Disassembly | stock movement in production |
| Cost allocation, Additional costs | write-off of stock to the cost price of products |
| Entering opening balances | opening balances when accounting is set up |
For more on the documents, see Goods receipt, Stock transfer between warehouses, Write-off and Assembly.
How to run the report
To run the Stock Movement report, open it in the “Reports” menu, set a period and click the generate button.
-
Open Reports → Stock Movement.
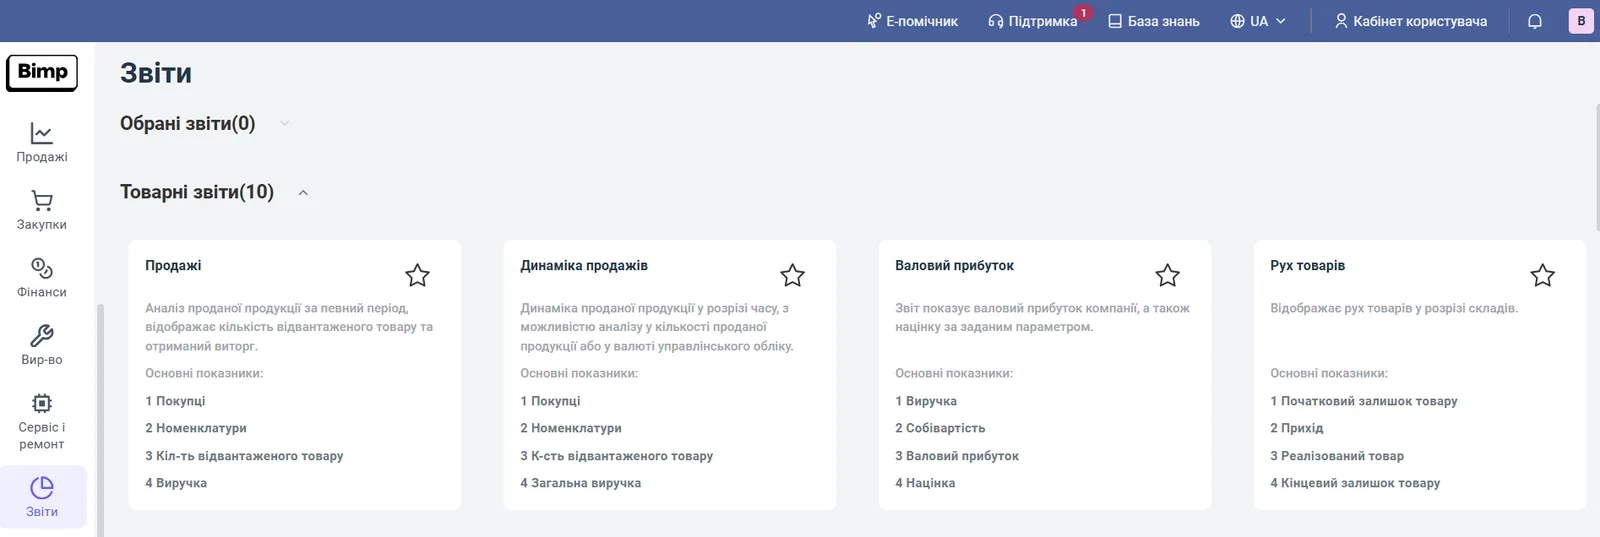
-
In the top left part, click the calendar and select a period, for example the current month.
-
If needed, open the Filters panel and set the selection conditions.
-
Select “Group by” and “Detail by” (see below).
-
Click Generate report. After you change the period or filters, the table does not refresh by itself, so generate the report again.
Indicators
The table shows the following columns; by default values are shown in quantity (pcs, m and so on).
| Column | What it means |
|---|---|
| “Opening balance” | the quantity at the start of the period |
| “Receipts” | how much arrived during the period |
| “Sales” | how much was sold during the period |
| “Write-offs” | how much was written off, including to production |
| “Transfers” | movement under Stock transfer documents; outflow from a warehouse is shown with a minus sign |
| “Closing balance” | the quantity at the end of the period |
| “Series” | the product’s series numbers |
| “Expiry date” | the product’s expiry dates |
The closing balance is made up as follows: opening balance plus receipts, minus sales, minus write-offs, plus transfers (taking the sign into account). The “Total” row at the bottom sums the columns.
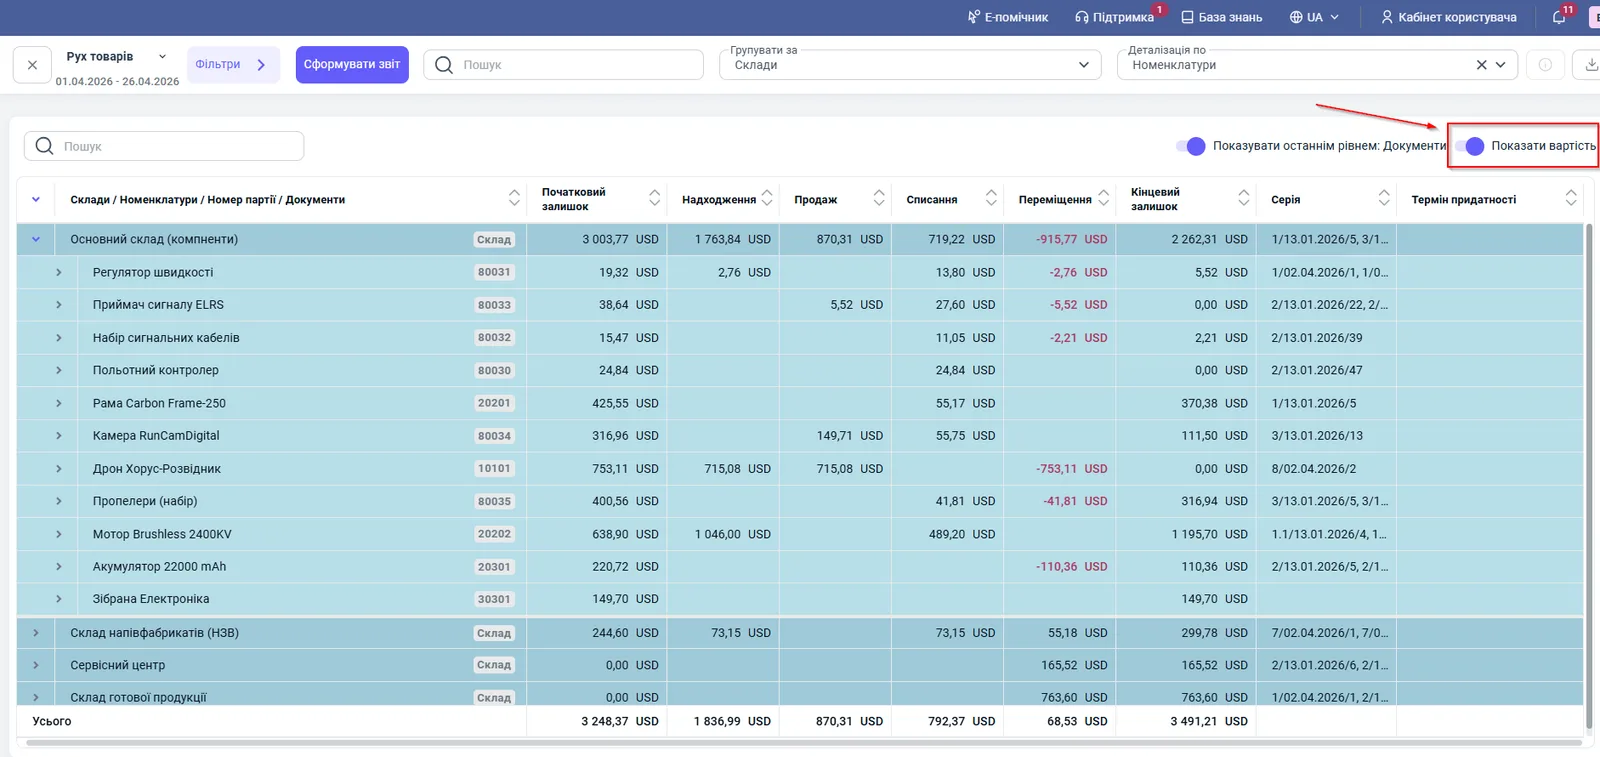
To see value instead of quantity, turn on the Show cost switch in the top right corner. The cost is calculated in the management accounting currency from the accounting settings.
Filters and grouping
Filters are in the left “Filters” panel; the selected settings can be saved as a template.
| Filter | What it gives |
|---|---|
| “Warehouse” | movement for a single warehouse |
| “Product” / product group | movement for a product or category |
| “Supplier” | movement of goods by supplier |
| “Batch number” | movement for a single batch |
| “Series” | movement for a series |
| “Expiry date” | selection by expiry date |
“Group by” is available by warehouse, product, product group and warehouse group. “Detail by” is by products, product groups and batch numbers.
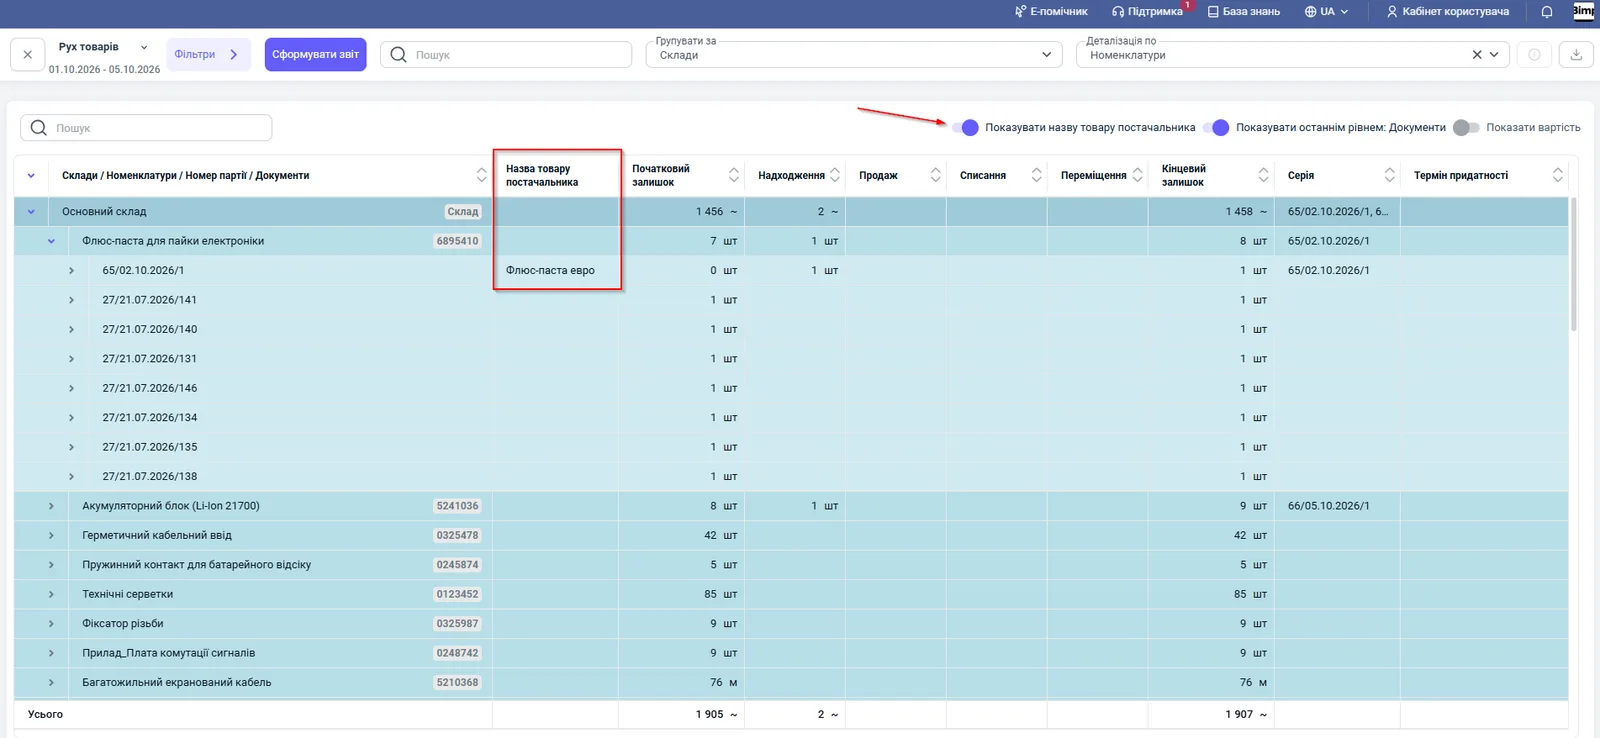
Switches above the table:
- Show as last level: Documents expands a product row to the documents that created the movement;
- Show supplier’s product name adds a column with the product name from the supplier’s products list, if you keep one;
- Show cost switches the report from quantity to money.
How to read the numbers: an example
Consider the warehouse “Main warehouse (components)” for 01.04.2026 – 26.04.2026 in cost mode (USD):
| Opening balance | Receipts | Sales | Write-offs | Transfers | Closing balance |
|---|---|---|---|---|---|
| 3,003.77 | 1,763.84 | 870.31 | 719.22 | −915.77 | 2,262.31 |
Check: 3,003.77 + 1,763.84 − 870.31 − 719.22 − 915.77 = 2,262.31. The item “Speed controller”: 19.32 + 2.76 − 13.80 − 2.76 = 5.52. A negative transfer means the goods left this warehouse for another, for example for the semi-finished goods warehouse.
Why the numbers do not match
The actual balance in the warehouse differs from the “Closing balance”. Expand the product to documents (the “Show as last level: Documents” switch) and check whether all receipts and issues are posted. An unposted document does not get into the report. To reconcile with a physical count, use a stock count.
The balance in this report differs from the Stock with Reserve report. “Stock Movement” shows the balance at the end of the period, while Stock with Reserve shows the current balance and reserve on a selected date.
A warehouse or product does not appear in the report. Check the “Warehouse” and “Product” filters and the period: if there was neither a balance nor movement during the period, there will be no row.
The cost is not what you expect. The cost is taken at cost price in the management accounting currency; after late additional costs or corrections to a receipt it changes. See Cost price recalculation.
FAQ
How do I see an amount instead of a quantity in the Stock Movement report?
Turn on the “Show cost” switch in the top right corner of the report. The cost is calculated in the management accounting currency specified in the company's accounting settings.
Why does the “Transfers” column have negative values?
A negative value is the outflow of goods from the sending warehouse under a Stock transfer document. At the receiving warehouse the same transfer is shown as a positive number.
How do I find the document that caused a balance discrepancy?
Turn on the “Show as last level: Documents” switch and expand the product row. Under it you will see the receipt, sales, write-off and transfer documents for the period.
Can I look at the movement of a specific batch or series?
Yes. Use the “Batch number” and “Series” filters or select detail by batch numbers.