
Gross profit report: revenue, cost price, margin
On this page
The Gross profit report shows the difference between revenue and the cost price of goods sold for a period, as well as markup and profitability. It helps you find unprofitable items, customers, and managers with low margins. It opens in the "Reports" menu and is built from posted sales documents, receipts, and documents that form the cost price.
What the Gross profit report is for
The Gross profit report shows how much the company earned on sales before administrative and operating expenses. It answers the question of which goods, customers, or managers bring real margin and which work at a loss.
Example: a company sold a batch of goods for 1,000 USD. In the report, the manager sees a negative gross profit: the purchase price rose while the selling price did not change. After that, the manager adjusts the price list. Another example: two managers have different revenue, but the one who gives discounts has a lower gross profit. So it is better to calculate bonuses from profit, not from turnover, see Sales managers’ pay.
Which documents form the report
The report is built from posted documents:
| Documents | What they form |
|---|---|
| “Sales of goods and services”, “Customer return” | Revenue |
| “Goods receipt”, “Return to supplier” | The cost price of purchased goods |
| “Additional costs”, “Cost allocation”, “Stock transfer” | The full cost price: expenses are added to the purchase price |
| “Write-off”, “Stock posting” | Profit or loss from defects and surpluses |
| “Assembly”, “Disassembly” | The cost price in production |
How the cost price is formed is covered in the article Cost price in Bimp.
How to generate the report
- Open Reports → Gross profit.
- Click the calendar in the top left panel and select the period.
- In the Filters panel, set the filters you need.
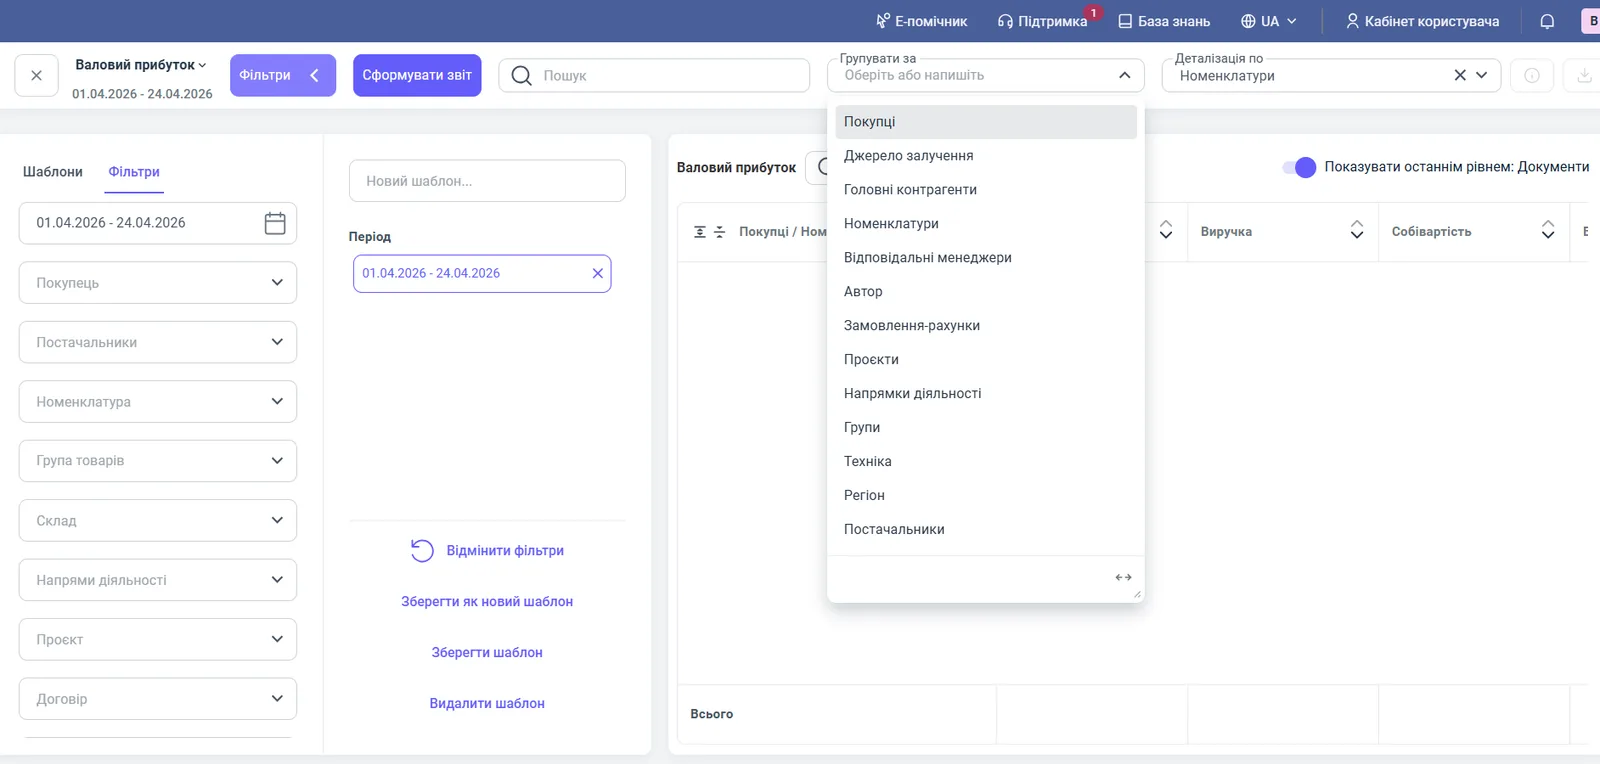
- Select “Group by” and “Detail by”.
- Click Generate report.
Report figures
| Column | What it means |
|---|---|
| “Quantity” | Sales in pieces |
| “Revenue” | The sales amount in the accounting currency, excluding VAT (or according to the accounting settings) |
| “Cost price” | The cost of purchasing or producing the goods sold, in the accounting currency |
| “Gross profit” | Revenue minus cost price |
| “Markup” | Gross profit divided by cost price, as a percentage |
| “Profitability” | Gross profit divided by revenue, as a percentage |
Negative values are marked with a minus. This is a signal to check purchase and selling prices or to reconsider the sales terms for the customer.
Filters and grouping
| Filter | What it selects |
|---|---|
| “Customer”, “Suppliers” | Profit for a specific customer or for a goods supplier |
| “Products”, “Product group” | Individual goods or categories |
| “Warehouse” | The shipping warehouse |
| “Lines of business”, “Project” | Profit by line of business or project |
| “Contract” | A specific contract |
| “Invoice order”, “Sales of goods and services”, “Payment form”, “Responsible manager”, “Price list”, “Equipment”, “Region” | Other breakdowns |
You can group by customers, parent counterparties, products, lead source, managers, author, invoice orders, projects, lines of business, groups, suppliers, equipment, and region. Detail is by the same dimensions. The “Show as the last level: Documents” switch shows the documents that make up the amount. General rules are in the article Reports in Bimp: filters, grouping, templates, export.
How to read the figures: an example
Take a product sold for 10,000 UAH with a cost price of 7,500 UAH:
- gross profit: 10,000 - 7,500 = 2,500 UAH;
- markup: 2,500 / 7,500 = 33.33%;
- profitability: 2,500 / 10,000 = 25%.
The same principle is visible in the Income and expenses (P&L) report: for February, “Sales income” of 1,386.46 USD minus “Cost price” of 621.56 USD gives “Gross profit” of 764.90 USD and a “Markup” of 123.06%.
Why the figures do not match
Revenue is lower or higher than in the Sales report. Check that the period and filters are the same, as well as the VAT settings in accounting: in “Gross profit”, revenue is excluding VAT.
The cost price is zero. The product has no posted receipt or opening balance with a cost price. Add a document or enter a balance with a cost price.
The cost price changed after the sale. Later documents, such as “Additional costs” or “Cost allocation”, change the cost price. See Cost price recalculation.
Profit appeared without a sale. The report takes write-offs and stock postings into account: surpluses found during a stock count give profit, and defects give a loss.
FAQ
How is gross profit calculated in Bimp?
Gross profit equals revenue minus cost price. For example, revenue of 10,000 UAH and a cost price of 7,500 UAH give a gross profit of 2,500 UAH.
How does markup differ from profitability?
Markup is the ratio of profit to cost price, profitability is the ratio of profit to revenue. With revenue of 10,000 UAH and a cost price of 7,500 UAH, the markup is 33.33% and the profitability is 25%.
Why is gross profit negative in the report?
The cost price of the goods sold exceeds revenue: the purchase price rose while the selling price stayed the same, or goods were sold at a discount below cost price. Check the prices in the price list and in receipt documents.
Why is the cost price in the report zero or changed after the sale?
The cost price is taken from receipt documents and additional costs. If they were posted or changed after the sale, recalculate the cost price.