
Expenses report: expense items and groups for a period
On this page
The Expenses report shows all company expenses for a period broken down by expense groups and items, counterparties, projects, and lines of business. It is built from salary accrual documents, expense reports, depreciation, receipts, write-offs, and other expenses. The Expenses report shows only the first-level group of an item, while P&L shows the full hierarchy.
What the report is for
The Expenses report shows where the company’s money goes and gives a transparent picture of the expense side by items and amounts. With it, you find items that take too much, cut unnecessary expenses in time, and plan a budget from historical data.
Example: after grouping by months, you see that logistics expenses (the “Selling expenses” group) grew by 40% in May because of a new carrier tariff. Another example: a project filter shows that project No. 2 is unprofitable because contractor expenses exceeded the plan.
Which documents form the report
Posted documents are included in the report:
- “Salary accrual” and “Piecework pay”;
- “Expense report”;
- “Depreciation”;
- “Goods receipt”;
- “Write-off”;
- “Other expenses”;
- “Prepaid expenses”.
For how to record expenses, see Period expenses, taxes, and other expenses.
How to generate the report
- Open Reports → Expenses.
- In the left panel, click the calendar in the “Period” field and select a time range.
- If needed, set the filters.
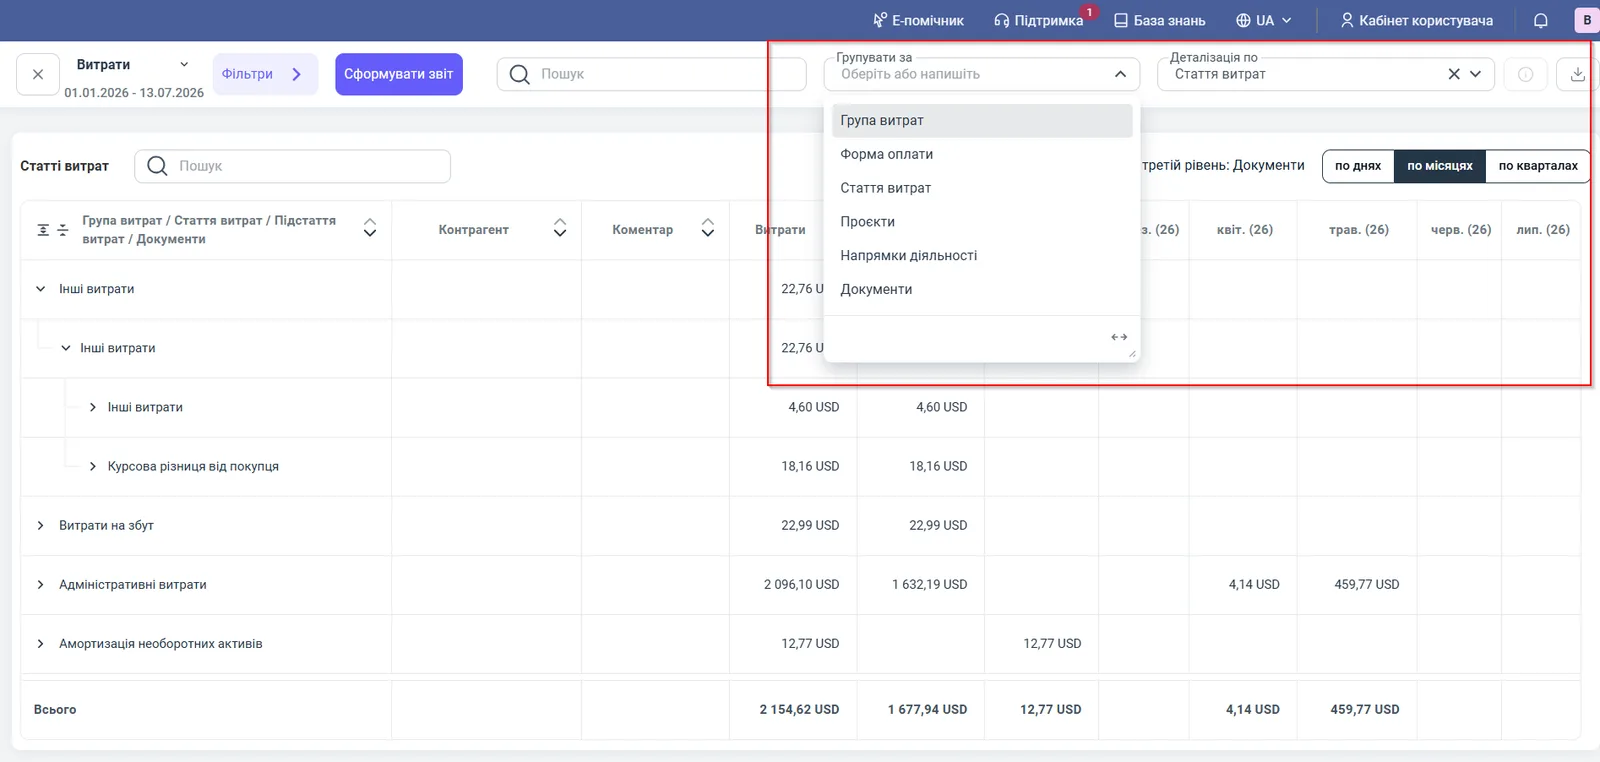
- In “Group by” and “Detail by”, select the structure of the table.
- On the right, select the column step: by days, by months, or by quarters.
- Click Generate report.
Report figures
| Column | What it means |
|---|---|
| “Expense group / Expense item / Expense sub-item / Document” | The row structure depending on grouping |
| “Counterparty” | Who was paid or from whom the service was received |
| “Comment” | The comment from the document |
| “Expenses” | The total amount of expenses in the accounting currency |
| Period columns | Expenses for each day, month, or quarter |
The “Show third level: Documents” switch adds the documents that make up the amount.
Filters and grouping
| Parameter | Value |
|---|---|
| Filters | “Project”, “Lines of business”, “Expense item”, “Counterparty” |
| “Group by” | Expense group, Payment form, Expense item, Projects, Lines of business, Documents |
| “Detail by” | Expense item, Payment form, Project, Line of business, Document |
Setting up templates and downloads is covered in the article Reports in Bimp: filters, grouping, templates, export.
Usage example
In the report for 01.01.2026 – 13.07.2026 grouped by expense groups, the “Total” row shows 2,154.62 USD. The “Administrative expenses” group gives 2,096.10 USD, “Selling expenses” 22.99 USD, “Depreciation of non-current assets” 12.77 USD, and “Other expenses” 22.76 USD (of which 18.16 USD is exchange rate difference from a customer). Expand a group to see the items, and the third level to see the documents.
Why the Expenses report shows a different structure than P&L
The Expenses report is meant for quick analysis and does not build a deep hierarchy. It takes the item from the document and pulls in only its first-level group. You see the item and the main category without intermediate subfolders.
The Income and expenses (P&L) report builds the full financial picture: it shows the whole path from the top group to the item. If the expense document has a group selected instead of a final item (for example, “Services”), the amount goes into the total of that group.
So use P&L for detailed nesting and “Expenses” for a quick assessment of categories.
Why the figures do not match
The expense total in “Expenses” differs from P&L. P&L adds cost price and depreciation as separate rows, while “Expenses” shows expense documents. Compare the same groups and period.
An expense did not appear. The document is not posted, or its item or project does not match the filters.
The payment was made, but it is not in “Expenses”. The report counts expenses by the accrual document, not by payment. See payments in the Cash flow report.
Non-operating expenses. A separate picture is given by Non-operating income and expenses.
FAQ
Why are expense items grouped differently in the Expenses and Income and expenses reports?
"Expenses" pulls in only the 1st-level group for an item, while "Income and expenses" (P&L) builds the full branch from the top group to the item. For a quick assessment of categories use "Expenses", for a detailed analysis of nesting use P&L.
What happens if a group, not an item, is selected in an expense document?
In P&L, the amount goes into the total of that group as the parent category.
Which documents form the Expenses report?
Salary accrual, piecework pay, expense report, depreciation, goods and services receipt, stock write-off, other expenses, and prepaid expenses.
How do I see the expenses of a specific project?
In the "Filters" panel, select the "Project" you need or group the report by projects.