
Sales and Sales Dynamics reports: revenue for a period
On this page
The Sales report shows the quantity and revenue of goods and services sold by customer, product, manager, project and other dimensions. Sales Dynamics is its version with columns by days, months or quarters. The data comes from posted Sales of goods and services and Customer return documents. It opens from the "Reports" menu.
What the Sales report is for
The Sales report answers the question of what the company sold, to whom and for what amount over a period. Use it to find the products that make up most of the revenue and the customers who have reduced their volumes.
Example: over a quarter, the report shows that 20 items out of 100 give 80% of revenue. The rest can be reviewed for removal from the assortment. A manager sees that a large customer bought less than a month ago and offers them a discount.
The separate Sales Dynamics report is meant for analyzing changes over time: seasonal fluctuations, the effect of an advertising campaign (comparing sales before and after launch), and daily, monthly and quarterly figures.
Which documents feed the report
Only posted documents get into the report:
- Sales of goods and services: the fact of shipping goods or providing a service; see Shipment;
- Customer return: reduces sales; see Customer return.
A Customer order does not get into the report: it records an intention, not the fact of a sale.
How to run the report
- Open Reports → Sales (or Sales Dynamics).
- In the top left panel, click the calendar and select a period.
- If needed, click Filters and set filters.
- Select “Group by” and “Detail by”.
- Click Generate report.
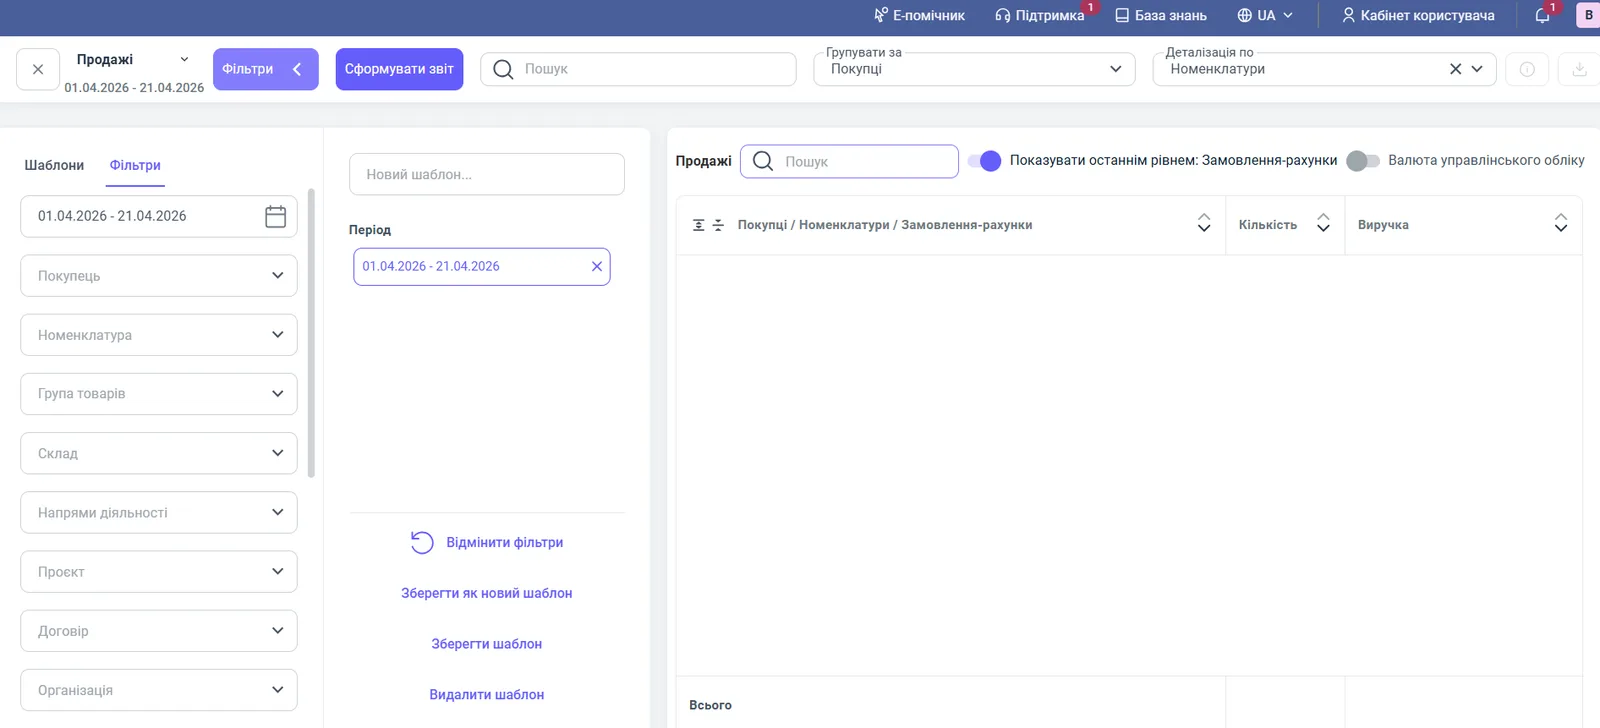
Common actions with filters, templates and downloading are described in Reports in Bimp: filters, grouping, templates, export.
Indicators
| Column | What it means |
|---|---|
| “Quantity” | How many units were shipped, taking returns into account |
| “Revenue” | The amount of sales for the selected period, in the accounting currency |
| Period columns (Sales Dynamics) | Revenue separately for each day, month or quarter |
The Sales report has the columns “Quantity” and “Revenue”. In Sales Dynamics, each row has a total “Revenue” and a breakdown by period. The “Show cost” switch adds the cost of the goods sold.
Filters and grouping
| Filter | What it selects |
|---|---|
| “Customer” | Sales to a specific client |
| “Product”, “Product group” | Individual products or categories |
| “Warehouse” | Which warehouse the goods were shipped from |
| “Lines of business”, “Project” | Sales by line of business or project |
| “Organization” | The legal entity you need, if there are several |
| “Contract”, “Form of payment”, “Responsible manager”, “Author”, “Price list”, “Equipment”, “Region” | Other analytics dimensions |
You can group by customers, parent counterparties, acquisition source, products, responsible managers, author, order invoices, projects, lines of business, organizations, groups, equipment and region. You can detail by products, parent counterparties, managers, author, order invoices, projects, lines of business, organizations, groups, documents, equipment or region. The “Show as last level: Order invoices” switch adds, at the end of the table, the documents the amount was made up of.
How to read Sales Dynamics: an example
In the Sales Dynamics report for 01.01.2025 – 02.09.2025 with grouping by customers, detail by products and the “by months” mode, each customer expands into a list of products, and the amounts by month are visible on the right.
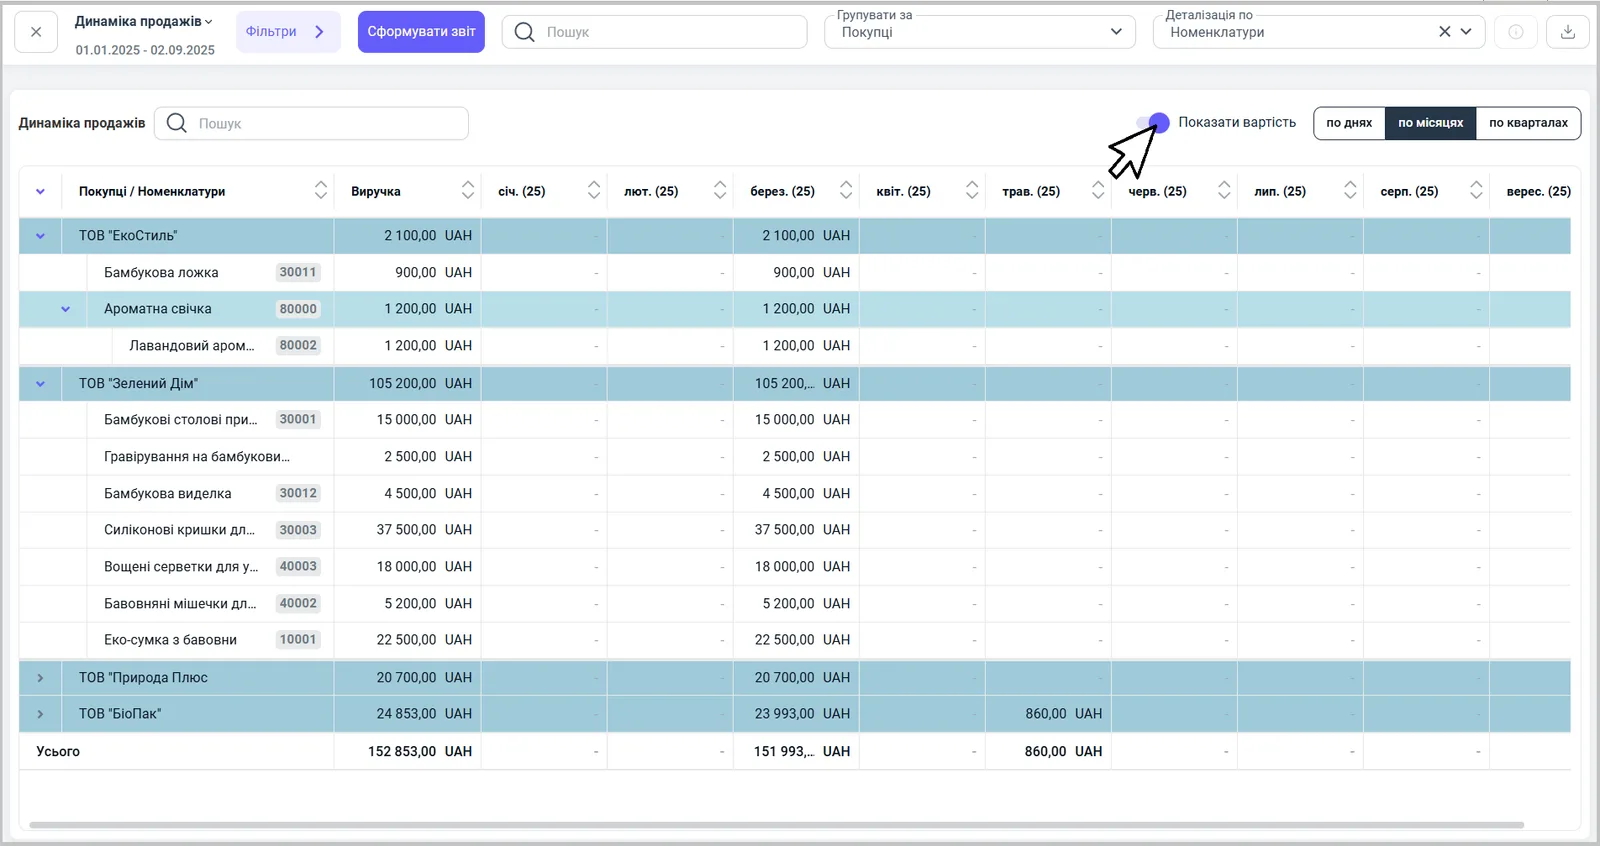
The customer EcoStyle LLC has revenue of 2,100 UAH, all of it in March: 900 UAH for a bamboo spoon and 1,200 UAH for a scented candle. The grand “Total” is 152,853 UAH: 151,993 UAH in March and 860 UAH in April. The sum of the monthly columns equals the total “Revenue” column.
Why the numbers do not match
There is a sale, but it is not in the report. Check whether the Sales of goods and services document is posted, whether its date falls within the period, and whether a filter that cuts the item out (warehouse, organization, line of business) is set.
Revenue is lower than in the orders. The report shows what was shipped, not what was ordered. For the difference, see the Shipments by Customer analysis report.
Revenue is higher than the sum of payments. The report counts by shipment, not by receipt of money. For payments, see the Cash Flow report.
Revenue in Sales does not equal revenue in Gross Profit. The Gross Profit report takes revenue without VAT, while Sales Dynamics is built on management accounting amounts. Compare reports with the same filters.
FAQ
Why is the order I created not in the Sales report?
The report is built from Sales of goods and services and Customer return documents, not from orders. Until the goods are shipped with a sales document and it is posted, the order is not in the report. For unshipped orders, see the Shipments by Customer analysis report.
How is Sales Dynamics different from Sales?
Sales Dynamics is a separate report with the same filters and groupings, but the amounts are split into columns by days, months or quarters. It is built on management accounting amounts.
How do I see the cost price of goods sold in the report?
In the Sales Dynamics report, turn on the “Show cost” switch. For the margin on each item, use the Gross Profit report.
Does the report take returns from customers into account?
Yes. Posted Customer returns reduce the quantity and revenue.